Debugging Tools
Unit Testing
Unit testing is part of the development process by which portions of the source code can be tested upon adherence to quality criteria or whether they fulfill expectations – hence a measure to minimize the need for debugging.
The following list is not comprehensive, we only attempt to give an overview for common languages used on our system. If you think a crucial part is missing: Feel free to contact us.
C++
For C++ we provide a module lib/Catch2/<version>, which contains the Catch2 framework headers and more. To use it, load the module. To see what is inside, look into the module itself:
ls $EBROOTCATCH2
Python
Unit tests for Python are build-in.
R
For R a package called <em>testthat</em> exists. This is currently not part of the R-modules, yet can be installed via cran.
Debugging Software Tools
Totalview
Intel’s Inspector
Valgrind On MOGON
Valgrind is - to quote its web site - “an instrumentation framework for building dynamic analysis tools. There are Valgrind tools that can automatically detect many memory management and threading bugs, and profile your programs in detail. You can also use Valgrind to build new tools.”
In particular Valgrind is frequently used to:
- detect memory problems (e.g. leaks and cache misses)
- detect problems related to branch misses
While the program suite is able to profile parallel programs (e.g. those with threading by OpenMP or even multiprocessing with MPI) it does not run programs in parallel. Threads for instance are serialized. This results in an fairly big overhead. If you want to analyze MPI-Programs, you may want to build Valgrind for the respective program yourself – you can ask the HPC-team for support (it might be simpler to try Linaro Forge, formerly known as Allinea and Arm Forge, which is installed on Mogon, too.).
debugger/Valgrind/<version>-<toolchain>.Things to consider when using Valgrind
Valgrind’s documentation is pretty good and straight forward, we recommend the quick start tutorial as well as the actual user manual.
Submitting jobs
When submitting a job for profiling consider the run time overhead or else the profiling might be partial, skewed and the output abbreviated: The run time overhead of valgrind is substantial (sometimes > 10x), therefore the test case should be small enough to run in reasonable time, yet big enough to yield meaningful results. This might require a trial and error approach for first set-ups.
Compiling for Valgrind
Remember to compile with -g -O0 (gcc, apply similar options for other compilers). -O1 might also work, but line numbers will not be accurate any more.
An example with visualization
Imagine you submit a job like:
srun -p smp -A <your account> -n 1 --mem 1800M -t 300 valgrind [other valgrind args] --tool=callgrind <path/to/cmd> [args]
where cmd is the program to profile with its optional arguments (args).
This will produce an output file (e.g. callgrind.out.44289, with 44289 being the PID of the process) which you can further analyze on the command line:
callgrind_annotate --auto=yes callgrind.out.44289 |less
Or - on login nodes - with kcachegrind:
kcachegrind callgrind.out.44289 &
giving results like
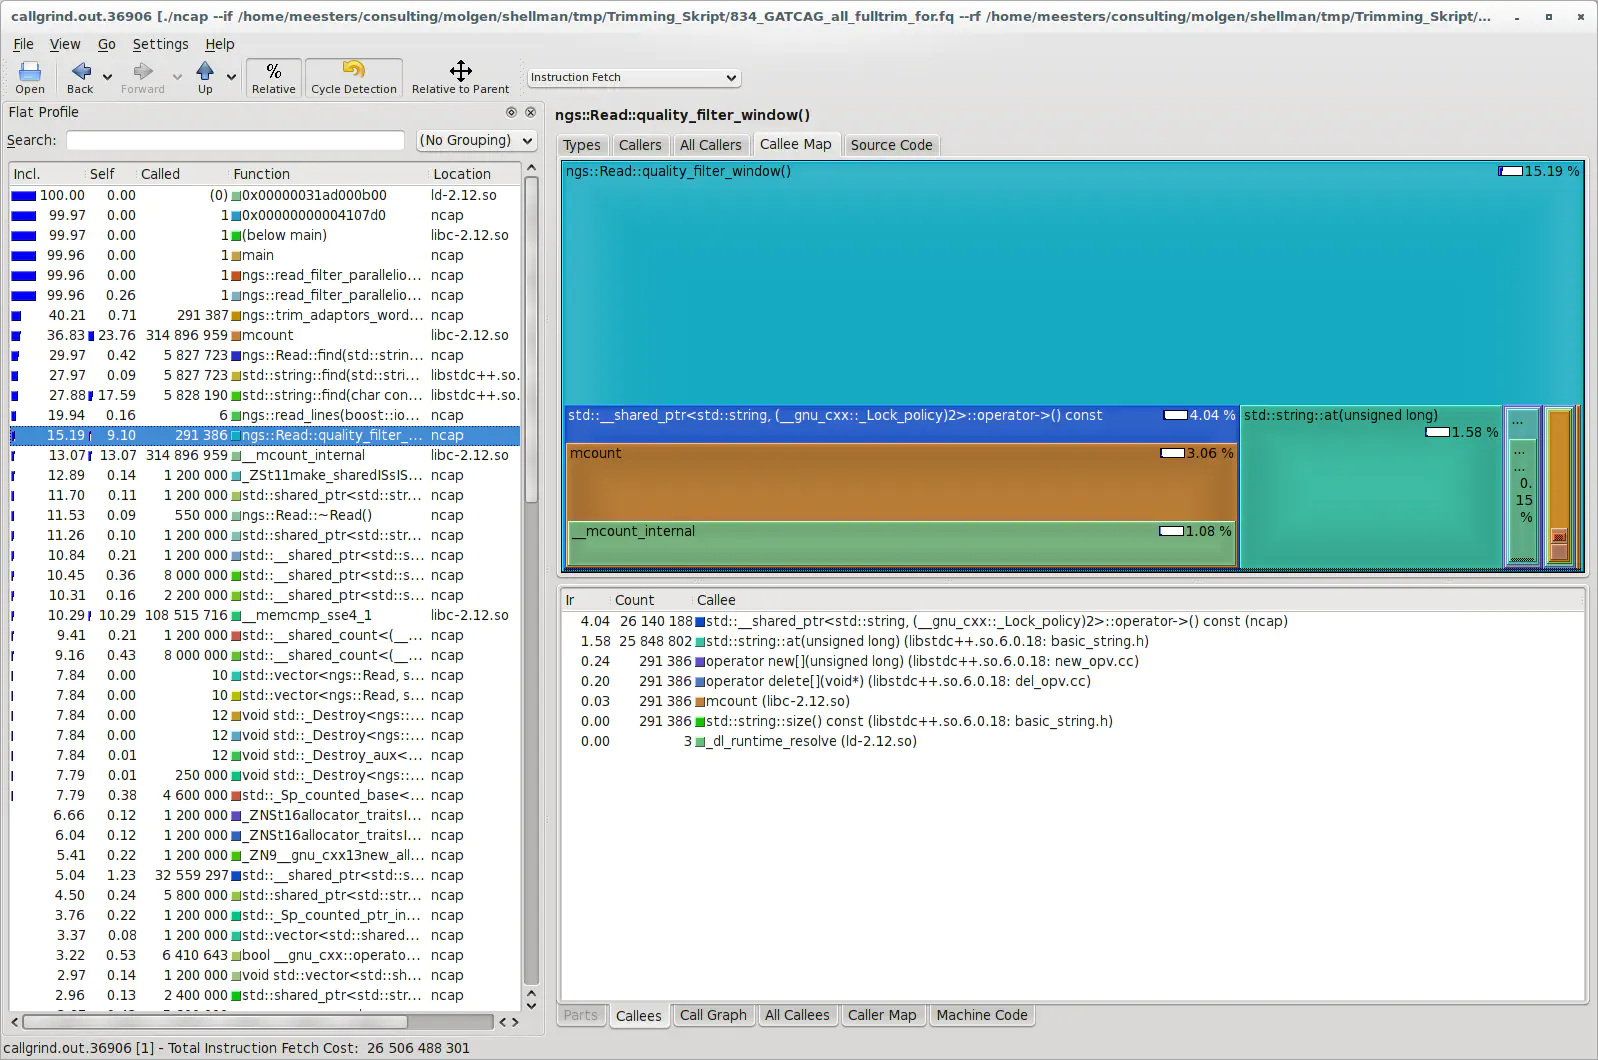
(displaying a function with obvious potential for improvements).