Intel VTune Amplifier is a powerful serial and parallel profiler which can be used to collect performance statistics of your code. VTune can profile code written in C, C++, C#, FORTRAN, Java, and Assembly. VTune is designed to be used on shared memory machines so code using MPI and/or OpenMP, as long as it is confined to run on a single node, can be profiled.
Set up the VTune environment by loading the VTune module as follows: module load tools/VTune
Build your application as you normally would but also turn on the compiler debug symbols. This is typically done by adding the -g option to the icc, gcc, mpicc, ifort, etc. command. This enables source-level profiling. It is recommended to use release build optimization flags (e.g. -O3 -xAVX). This way efforts can be spent optimizing regions not addressed by compiler optimizations.
Do not use this approach for jobs running longer than a few minutes - instead submit to the scheduler and view the results in the gui (see section below).
After loading the VTune module start the gui from the command line: amplxe-gui.
If this is the first time you have run VTune click New Project
Give your project a name and choose a location to store the analysis output
Choose the application that you built in the initial setup stages (Ex. ~/sample_code.exe).
Choose a working directory
Choose New Analysis; then Basic Hotspots." It is recommended to start with basic hotspots and then move to more advanced profiling analyses if necessary.
On the right hand side click the Start button.
Your application will no run in the background while VTune collects data. The amount of time this takes is individual to your application; VTune should not add a noticeable amount of overhead.
To stop your application prematurely, click stop on the right hand side. This stop the program and collection, but will still display the partial results.
VTune will then finalize the results and display a summary page.
Assuming the application was compiled with the -g flag, the Top Hotspots should point out the most time consuming functions/subroutines of your program.
The CPU usage histogram is not applicable for serial codes - you can safely ignore this.
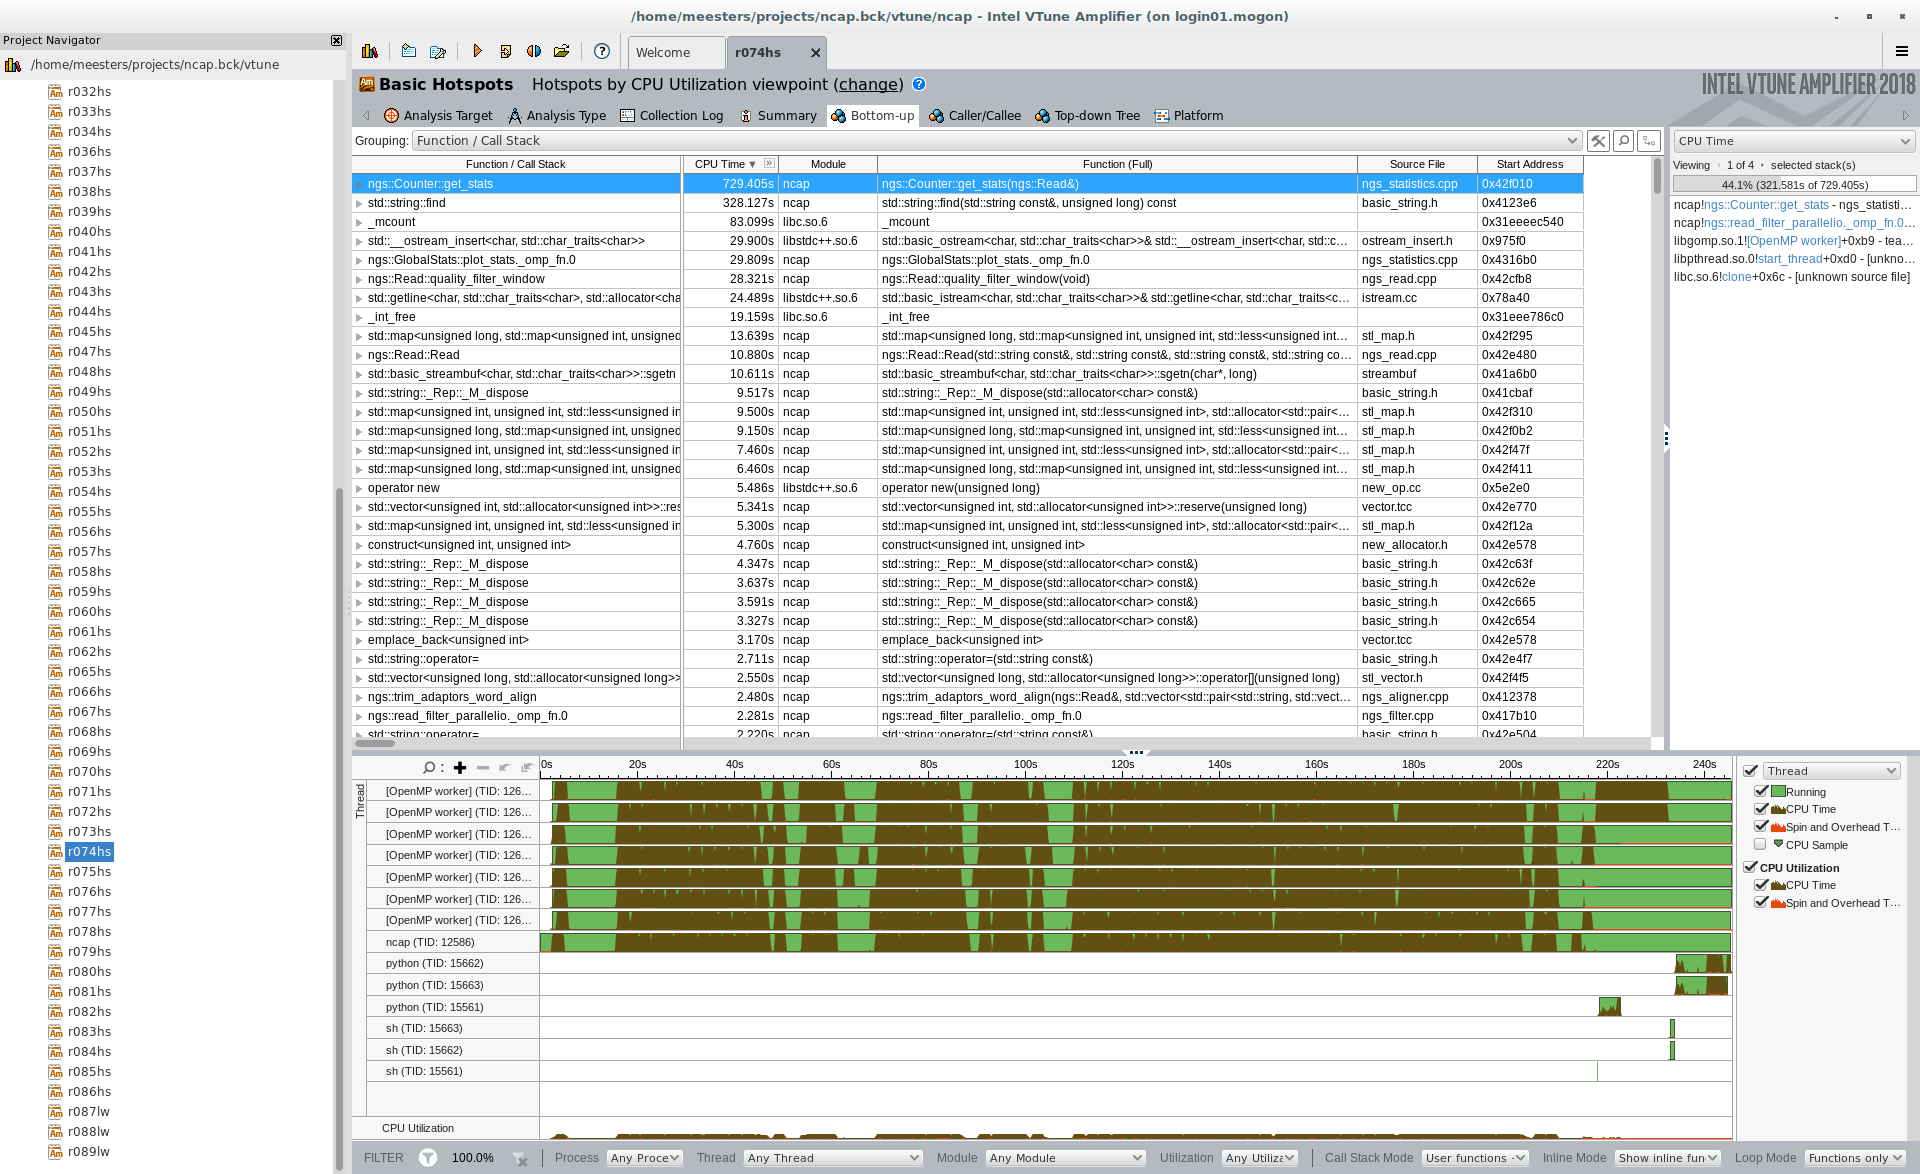
You can see more information by clicking on the bottom-up or top-down tree.
Double clicking on a line will bring you to the source code of the application and show CPU usage on a per source code line basis.
This will point you to the areas that should be the focus of your optimization efforts.
The instructions here detail how to submit your program to run with the VTune collector on a remote compute node and then finalize and visualize the results in the GUI on the head node.
Build your application as you normally would but also turn on the compiler debug symbols. This is typically done by adding the -g option to the icc, gcc, mpicc, ifort, etc, command. This enables source-level profiling. It is recommended to use release build optimization flags (e.g. -O3, -xAVX). This way efforts can be spent optimizing regions not addressed by compiler optimizations.
Load your application as described above and load the module.