Title here
Summary here
Performance Analysis and Optimization with TotalView
TotalView is available as a module with:
ml debugger/TotalViewCompatability Warning!
The current versions of TotalView are only able to parse code compiled with gcc 9 or earlier. You will not even get assembler code if you use the wrong compiler version!
Debugging can be a heavy load on the ssh tunnel and is difficult with just the command line inputs of shells. For this reason you should enable X11 forwarding,-X , (so totalview can open a window) and compression -C as wll as the -Y flag (designating a trusted connection) when accessing the login node. For example:
ssh -X -C -Y <mogon login>Once you are on mogon you will need to access the requested node for debugging. You will need to use salloc and specify X11 forwarding again:
salloc -N 1 -p parallel-A zdvhpc
  salloc: Granted job allocation 3242
  salloc: Waiting for resource configuration
  salloc: Node <allocated node> are ready for job
ssh -X <allocated node>
Using an interactive shell with srun will not be possible as X11 forwarding will not be enabled.
There are three ways to start debugging:
totalview a.out [ -a options ]totalviewYou will be asked what you would like to debug. Choose A running program (attach) and look for your already started program.
Alternatively you can select a program in a folder to open after totalview has started.
totalview a.out <corefile>If the program requires startup parameters like runtime arguments, environment variables or standard IO these can be set in the Process -> Startup Parameters… menu. After starting your programm Total View opens the Process Window which consists of different parts summarized by the table below:
| Source Pane | displays the program’s source code |
| Stack Trace Pane | displays the call stack |
| Stack Frame Pane | displays all variables associated with the selected stack routine |
| Tabbed Pane | displays all breakpoints, action points and evaluation points in the Action Points subpane displays all (MPI) processes in the Processes subpane displays all threads of the current process in the Threads subpane |
| Status Bar | displays the status of the current process and thread |
| Toolbar | contains all action buttons |
After starting the program, if the uncompiled code file is in the same directory as the compiled code, you should see something like this:
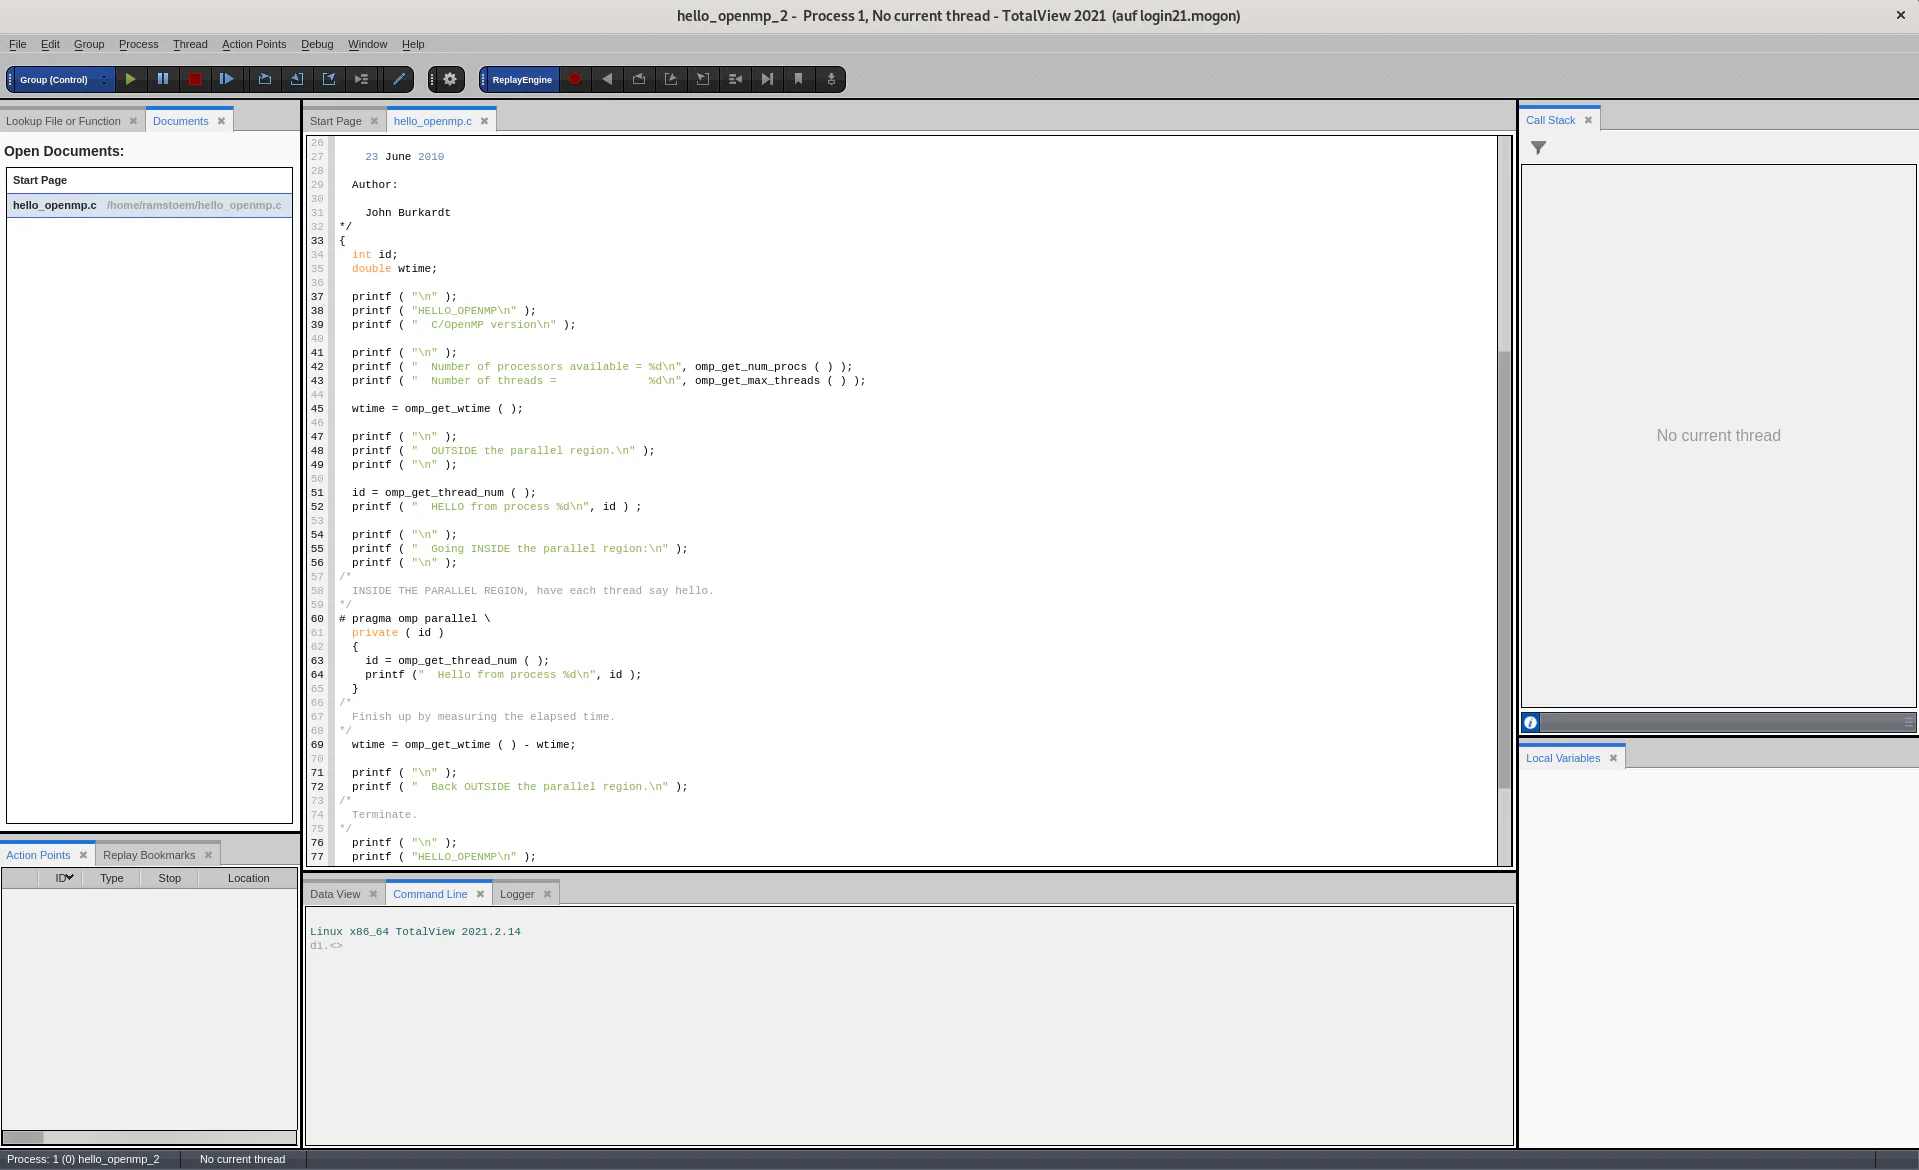 The top middle is the source pane. To its right is the stack trace pane and the left contains open documents, a search tab and a threads pane in the case of multithreaded porograms. On the bottom left an overview of all action points can be found, as well as bookmarks for the replay engine if it is used. The bottom right contains local variables. The bottom middle contains a logger for TotalView, access to the command line and a Data View
If no uncompiled code file can be found TotalView will instead attempt to display assembler code.
The Stack Frame Pane provides values of simple variables. You can also search for a specific value using the View → Lookup Variable command. This will bring up a new window, where you need to enter the name of the variable you are interested in. The value of the variable as well as its address and its type are then shown in the Variable Window. Alternatively, you can also dive (middle click) on a variable to open the Variable Window. If an array is examined in the Variable Window the Slice and Filter fields can be specified to only show a subset of all entries of the array. For example, Slice: 1:10:2 will show every second entry starting from index 1 and ending with index 10. Specifying Filter: > 30 will only show array entries that have a value larger than 30. Arrays can also be visualized using the Tools → Visualize command in the Variable Window as long as they array is one- or two-dimensional. If you are examining a structure variable that contains other structures you can dive in the hierarchy of structures and navigate through it using the left and right arrow buttons in the top right of the Variable Window.
A breakpoint can easily be set by clicking on a boxed line number of an executable statement in the Source Pane. To remove a breakpoint just click on the corresponding boxed line number again. Once the program has stopped you can go through it line by line using the Next button in the command line. Alternatively the program can be resumed after inspecting the code by using the green Go button Other action points can be created by using the Action Points menu at the very top of the screen.
An Evaluation Point can be used to temporarily add some program lines. Some basic examples are illustrated by the table below:
| Additional print statement (FORTRAN write not accepted) | printf(“x = %f\n”, x/20) |
| Conditional breakpoint | if(i == 20) $stop |
| Stop after every 20 executions | $count 20 |
| Jump to program line 78 | goto $78 |
| Visualize an array | $visualize a |
A watchpoint can be used to monitor the value of a variable. Each time the value at the corresponding memory location of the variable is changed the program is stopped.
Different memory debugging features are offered by TotalView. Dynamically allocated memory can be guarded. If a memory access outside the boundaries of an allocated block occurs the program will stop. Memory can also be hoarded to avoid program crashes if the program accesses a memory block that has already been freed. TotalView can also detect memory leaks. Memory debugging needs to be enabled before starting the debugging process using the Debug → Enable memory debugging command. After that you can set a breakpoint and let the program run in to it. The memory debugging window can be displayed by the Debug → Open MemoryScape menu entry. In order to detect memory leaks select the Memory Reports → Leak Detection tab and choose either Source report or Backtrace report to get a list of leaking memory blocks.
Another interesting feature of Totalview is the ReplayEngine which records the program execution. As a result each program state can be restored afterwards. This feature allows to step forward and backwards through the code. So you can track errors causing a failure back from their occurence without restarting the application. In order to enable the ReplayEngine just click on the Record button in the Toolbar or use the Debug → Enable ReplayEngine menu entry. Note that the program needs to be stopped for that. If the program was only loaded but not yet executed the ReplayEngine will start recording as soon as the process starts to execute the program. If the program is restarted the ReplayEngine will again record data from the beginning of the process execution. However, if the program is already executing but was halted enabling the ReplayEngine will only record execution data from that point on and only for a single time. The ReplayEngine offers different commands in the Toolbar shown in the table below:
| Record | A toggle to enable/disable the ReplayEngine. |
| GoBack | Displays the state that existed at the last action point or at the start of its recording if no action point is encountered. |
| Prev | Displays the state that existed when the previous statement executed. Function calls are skipped over. |
| Unstep | Displays the state that existed when the previous statement executed. In case of a function call moves to the last statement of that function. |
| Caller | Displays the state that existed before the current routine was called. |
| BackTo | Displays the program state for the selected line (must have executed prior to the currently displayed line). |
| Live | Shift from replay mode to record mode. |
| Save | Saves the current replay recording session to a file |
Before debugging a parallel application you should first get familiar with TotalView by debugging a serial toy program first.
You can either start TotalView in the New Launch or the Classic Launch way. The New Launch is similar to the launch of a serial program. After starting TotalView with your program as an argument the Startup Parameters window appears. In the ‘Parallel’ pane you can specify the Parallel system (e.g. Open MPI, Intel MPI) and the number of Tasks (i.e. the number of MPI processes to start). If you want to specify these parameters from the commandline instead of in the GUI choose the Classic Launch way. Depending on the MPI implementation used the arguments that are passed to the mpiexec command may differ. For Intel MPI and Open MPI the flag -tv needs to be set as the following example shows:
mpiexec -tv -np 2 a.out < inputA dialog window may appear stating: “Process … is a parallel job. Do you want to stop the job now?”. Clicking Yes will open the TotalView debugger window with the source pane. In order to display the source code of your MPI program look for the main function in the Stack Trace Pane and click on it. By default the process with MPI rank 0 is selected for debugging. Clicking on another process in the root window selects another process. Alternatively, the buttons P- and P+ in the bottom right of the Process Window can be used as well. You can also open a separate Process Window by right-clicking on a process in the root window and selecting Dive in New Window.
For each MPI process a separate TotalView license token is consumed. These licenses may be limited at your site. Hence, it is recommended to reduce the number of MPI processes to a minimum. With only a few processes the debugging process becomes easier to handle. If your problem only occurs with a large number of MPI processes you can attach the TotalView debugger only to a subset of your MPI processes. Therefore navigate to the File → Preferences → Parallel menu and under When a job goes parallel set the checkbox on Ask what to do instead of the default Attach to all. At the next start up of a parallel job a Attach Subset window will open where you can check the processes that TotalView should be attached to. This subset of processes can be changed at any time using the Group → Attach Subset menu.
Breakpoints can be set in the same way as for debugging serial programs. However, for debugging parallel programs you can specify the properties of the breakpoint by right-clicking on it and selecting Properties. In the Properties Window you can specify whether the breakpoint will stop the whole process group or only one process. It is also possible to turn a breakpoint into a barrier to synchronize all processes by right-clicking the breakpoint and selecting Set Barrier.
Program start, stop and restart are identical to debugging serial programs. However, you can choose to control the whole group of processes or only a single one using the drop-down menu on the left of the Toolbar.
In contrast to a serial program each process stores its own copy of a variable in its memory. Thus, a variable may have different values across different processes. These values can be examined by diving in a variable to open the Variable Window and then selecting View → Show Across → Processes. Alternatively, you can right-click on a variable and select Across processes which has the same effect. A graphical visualization of these values can be displayed by selecting Tools → Visualize in the Variable Window.
You can have a look at outstanding message passing operations like pending sends and receives by inspecting the Message Queue which can be found under Tools → Message Queue. There is also a visualization in form of a graph available under Tools → Message Queue Graph. This graph can be useful to detect deadlocks in your program. Therefore open the Message Queue Graph Window and select Options → Cycle Detection.
Before you start debugging an OpenMP program it is important to verify that the corresponding serial program runs correctly. Typical errors when parallelizing a program with OpenMP are data races. These errors are hard to detect with a debugging session because the timing behavior of the program is heavily influenced by the debugger. In this case it might be better to use a Thread Sanitizer tool. Moreover, you should make sure that the program code is compiled with debug information (-g flag) and without any optimization because specifying the corresponding OpenMP compiler flag causes the compiler to automatically turn on optimization. The table below provides the corresponding flags for some commonly used compilers:
| Intel compiler | -qopenmp -O0 -g |
| GCC compiler | -fopenmp -O0 -g |
| Oracle Studio compiler | -xopenmp=noopt -g |
| PGI compiler | -mp -Minfo=mp -O0 -g |
In order to start a debugging session for your OpenMP program specify the number of threads you want to use and call the TotalView command with your program as an argument as follow:
OMP_NUM_THREADS=<nthreads> totalview a.outThe original source program is transformed by the interpretation of the OpenMP compiler directives. Each parallel region becomes a separate subroutine. Shared variables are passed as call parameters and private variables are defined locally. You cannot enter a parallel region by stepping into it but only by running into a breakpoint. To switch between different threads in the Process Window you can either select another thread in the root window or by using the T- and T+ buttons in the bottom right of the Process Window.
Breakpoints are set by clicking on a boxed line number in the Source Pane. For parallel programs you can specify the properties of a breakpoint. By default running your program into a breakpoint will stop the whole process (group). But it is also possible to only stop the thread for which the breakpoint is defined. Moreover a breakpoint can be used to synchronize all threads. Therefor right-click on the breakpoint and select Set Barrier.
Program start, stop and restart work exactly like for serial programs. However, in a parallel OpenMP application you can choose to control the whole Group, the Process or the individual Thread using the drop-down menu on the left of the Toolbar.
In a parallel OpenMP program each thread may have an own copy of a variable. This is the case for private variables. Hence, the value of such a variable might be different across different threads. In order to examine these values you can dive in a variable to open the Variable Window. There you can select View → Show Across → Threads and will get a list of the values for each thread. Alternatively, you can right-click on a variable and select Across Threads which has the same effect. These values can also be visualized graphically by opening the Variable Window and selecting Tools → Visualize. Note that only one-dimensional arrays or array slices can be visualized in this way and that the thread ID is interpreted as an additional dimension.